

How to include pie chart using Google charts

Pie chart is an important and easy tool to represent data in efficient and easy way. In this discussion we go through how to include it in your projects in an easy manner
Step1: Include the cdn of google chart in your file
<script type="text/javascript" src="https://www.gstatic.com/charts/loader.js"></script>
Step2: Include a div in your html code which holds this pie chart
<body>
    <div id="piechart" style="width: 900px; height: 500px;"></div>
  </body>
Step3: Now we will give the data of our pie chart using javascript
<script>
google.charts.load('current', {'packages':['corechart']});
google.charts.setOnLoadCallback(drawChart);
function drawChart() {
var data = google.visualization.arrayToDataTable([
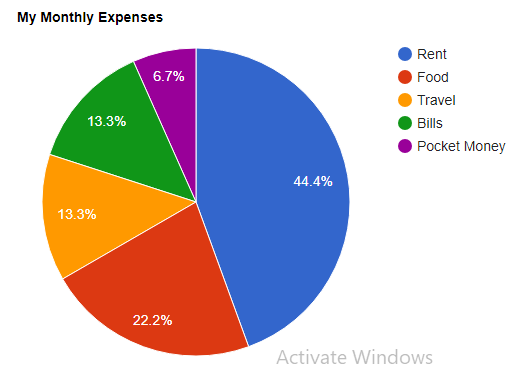
['Expenses', 'Cost in rupees'],
['Rent', 10000],
['Food', 5000],
['Travel', 3000],
['Bills', 3000],
['Pocket Money', 1500]
]);
var options = {
title: 'My Monthly Expenses'
};
var chart = new google.visualization.PieChart(document.getElementById('piechart'));
chart.draw(data, options);
}
</script>
Our pie chart looks like:
To make the chart looks like 3d give is3D in options of the script code
 var options = {
          title: 'My Daily Activities',
          is3D: true,
        };
Tagged: